Data Dive - April
Explore the history of spring arrivals on the reserve in our April Data Dive
Whether rain, shine or blizzard, our reserve team do a daily count of the wild animals on our site.
In these monthly blogs, we look at that data from years gone by and explore trends, observations and records, and talk about how we manage the site and how it impacts those animals.
This month we explore how our changing climate affects migratory birds by looking at the sand martin and the blackcap, and how our love for nature has become a driving force for them
Spring is now in full bloom here at WWT Washington - the daffodils line the grassy verges and bluebells are beginning to carpet the woodlands in the dappled light beneath the trees. The arrival of blossom and the morning chorus of songbirds signals a long-awaited warmth to the sun we’ve missed throughout winter. The arrival of our spring and summer breeding birds fills the site with activity, whether on the lakes and amongst the reedbeds or throughout the woodlands and meadows – the whole reserve is bursting into life.
Many of the seasonal breeders that migrate to the UK in springtime arrive around April time here at Washington. Warblers can be seen or heard throughout April: the chiffchaff is typically already well-established and busy nesting, the willow warbler follows shortly after its usual late-March arrival and by the final week of April we often see the return of the sedge warbler – often seen around the reedbeds. Swallows arrive and can be seen flitting and darting over the water to feed and an occasional common sandpiper will be sighted before the month closes.
Another bird which usually arrives in April here at Washington - and is a cousin of the swallow - is the sand martin.
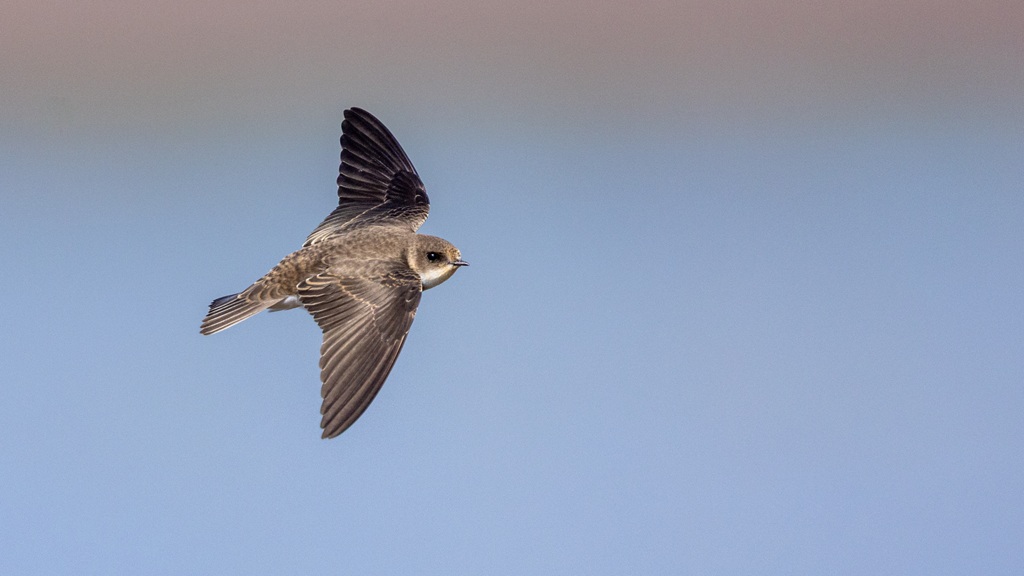
The sand martin is a long-distance migratory bird to the United Kingdom. They over winter in sub-Saharan Africa and have been recorded travelling over 4,000km between their summer and winter homes – that’s about the same distance from WWT Washington to the North Pole, and they make the trip twice every year!
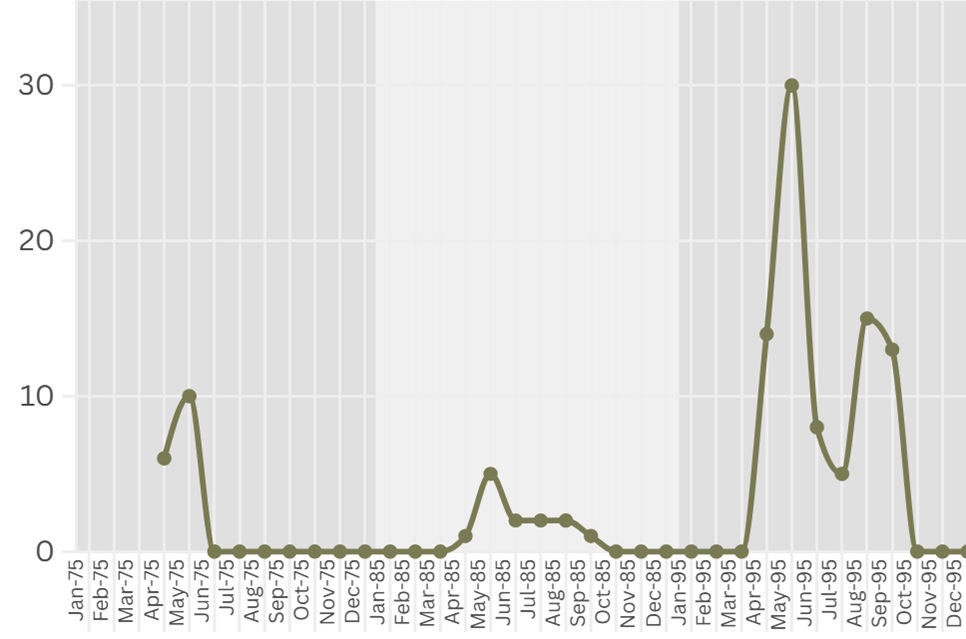
Unfortunately, during the winter of 1968/69 and then again in 1982/83, severe droughts in the Sahel region of Africa caused substantial population crashes for sand martins. This decline is even visible in the historic records here at Washington, where consistent populations of sand martin were recorded up to the spring/summer season of 1982 - then none were seen in 1983.
Thankfully, in more recent decades the UK population of sand martin are increasing and becoming stable, so much so that in 2015 the British Trust for Ornithology moved them from the Amber List (bird species of conservation concern that have not yet become critically endangered) to the Green List (bird species with the lowest conservation concern, meaning they are currently common and not under threat).
To promote sand martin visitation and conservation, the reserve team here at Washington constructed a nesting bank containing 100 nest boxes in the October of 2023, this was after noticing the sand martin unsuccessfully trying to nest in the banks of the river Wear and after some other previous attempts at trying to encourage the sand martin to nest around Wader Lake had been ineffective.
The graph below shows peak monthly counts for sand martin across the last 10 years; we can see a high count of 34 in May 2016 and two high counts of 34 and 36 in June and August of 2024.
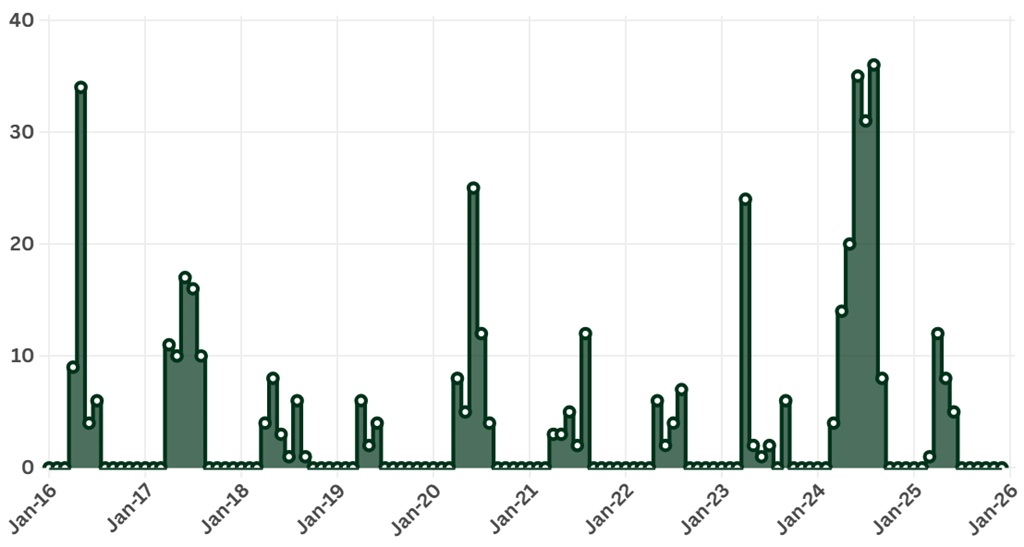
The graph shows that the 2024 breeding season that followed the construction of the nesting bank, there was a substantial increase to the sand martin population. While only just beating the 2016 peak, there was a much wider peak in 2024 – meaning that the sand martin were active here for a longer period than previously recorded. We can see that they were present on site over 7 months in 2024, which is notable when compared to the usual 3-5 months most years saw.
This was because of the birds using the new nesting bank!
The sand martin were easier to spot (and count) as they entered and left their nests. As well as the increased interest from staff and visitors, wanting to see if our new nesting chambers were working which attributed to a fantastic season of data collecting – our visitor surveys, where we asked for your help to spot sand martin and record which nest chambers they used, allowed us to get a wonderful overview of chamber preferences and gauge the success of the nest bank.
The 2025 season however seems to pale in comparison, with fewer birds recorded and less activity overall. This was most likely due to the weather: last year we had record high temperatures and several months without rainfall across the start of the breeding period, causing problems for many birds, mostly due to a lack of insect life. Which in turn made many of our breeding birds postpone egg laying. Hopefully this year will see more favourable conditions for the sand martin and we’ll see the nest chamber back in full swing again!
Looking further back in the records on the graph below – which covers peak counts from 1975, 1985 and 1995—we see a healthy population in the mid 90s, with a peak of 30 recorded in May 1995. In contrast, the mid 80s, following the 1982/83 Sahel drought, show a much lower peak of just 5 birds in May 1985. Going back another decade to 1975, the year we first opened, the peak count was 10—an echo of the 1968/69 Sahel drought captured by the very first reserve wardens more than half a century ago.
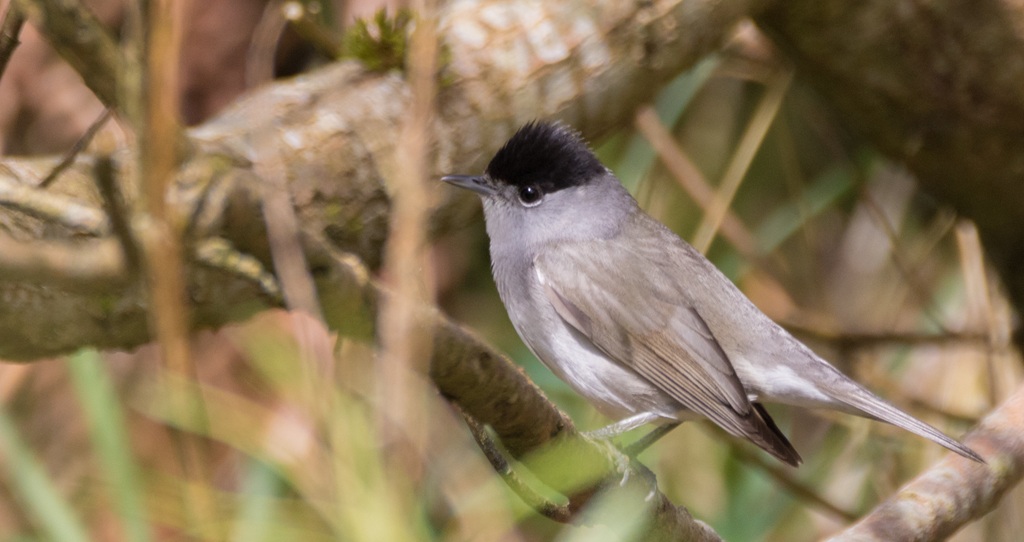
Another regular April sighting at WWT Washington is a small warbler, the blackcap. While the females are a chestnut brown colour, blackcap get their name from the distinctive black markings that the males have on the top of their heads. With their cheery, flute-like call, this little bird is often seen and heard throughout spring and summer, starting to arrive in late March, but records here show solid sightings throughout April and well into summer.
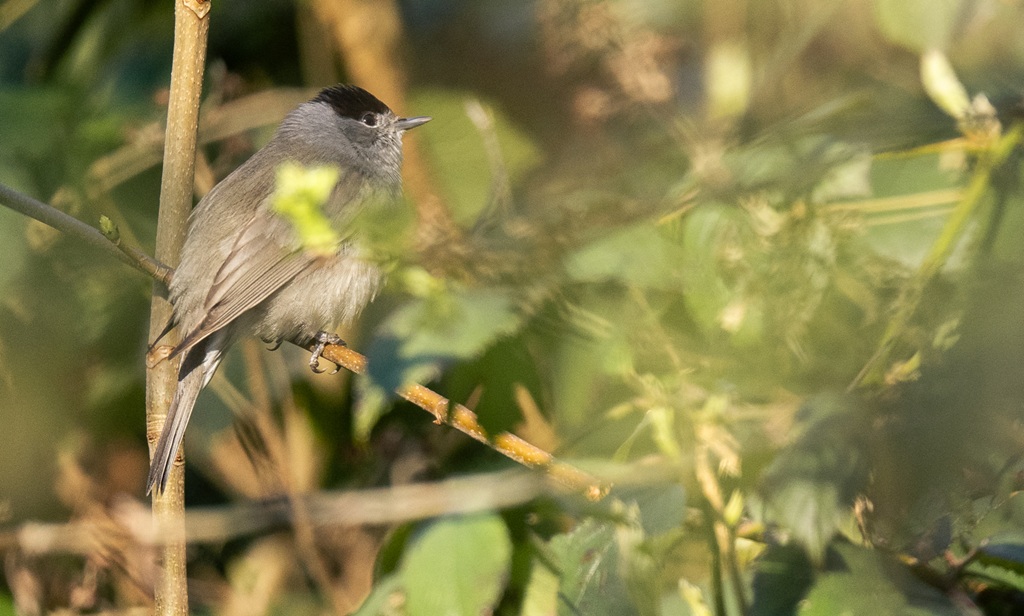
Blackcap are a summer visitor to the UK, flying across from Europe to breed, after which they would normally then fly south again for the winter. Interestingly however, since around the 1970s, central European blackcap have now started to come to the UK during the colder winter months - this is partially due to our winters getting milder but has also been attributed to our love of feeding our garden birds. A plentiful supply of seeds, nuts and mealworms across the British gardens in winter has spurred this curious migratory trend.
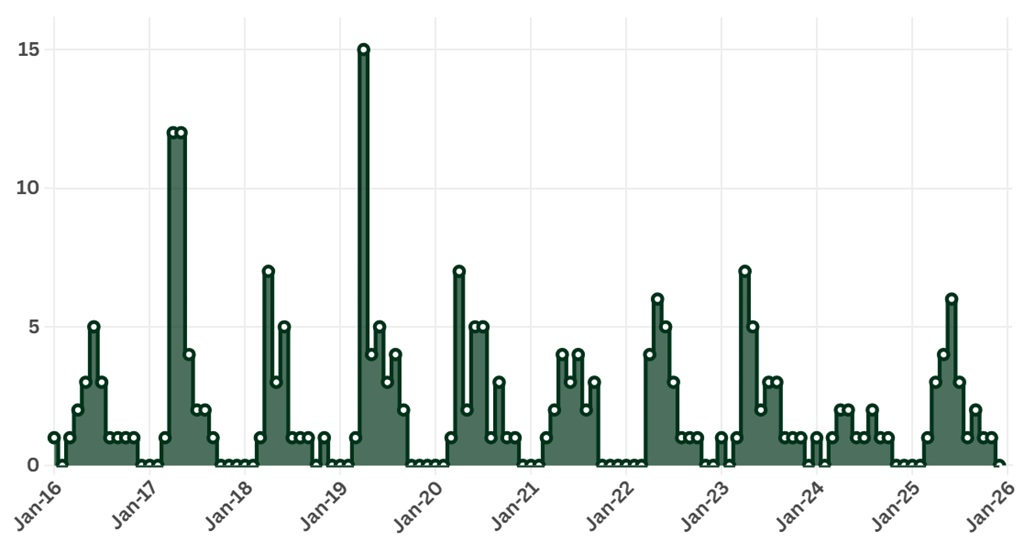
If we look at the chart below, which shows the highest daily count of blackcap for each month over the last decade, we can see that early spring has plenty of activity across the site. Highest counts were 15 in April 2019 and 12 in April and May 2017, April also had the highest counts in 2018, 2020 and 2023. We also see a similar pattern with the blackcap as we did in last month’s Data Dive with the chiffchaffs - two or three peaks across the season with dips between them. This is due to higher activity on either side of the birds sitting on eggs in nests - when they’re initially building their nests, attracting mates and fighting over territory but then also when young birds fledge after the nesting period. Blackcap can also sometimes have two broods a year here in the UK, which might potentially explain the years where there is a third prominent peak.
Looking at where on site the blackcap are recorded on the chart below, which shows the percent of sightings at various locations, we see a similar pattern to the chiffchaff from last month’s Data Dive - widespread across the site but observed more in locations with plenty of food. The Hawthorn Wood Hide bird feeders being a top spot, they’re also seen regularly at the Amphibian and Dragonfly Ponds and throughout the woodlands and hedgerows here at WWT Washington. Other Areas includes pretty much the entirety of the rest of the site - although no one location had more than 1% of records.
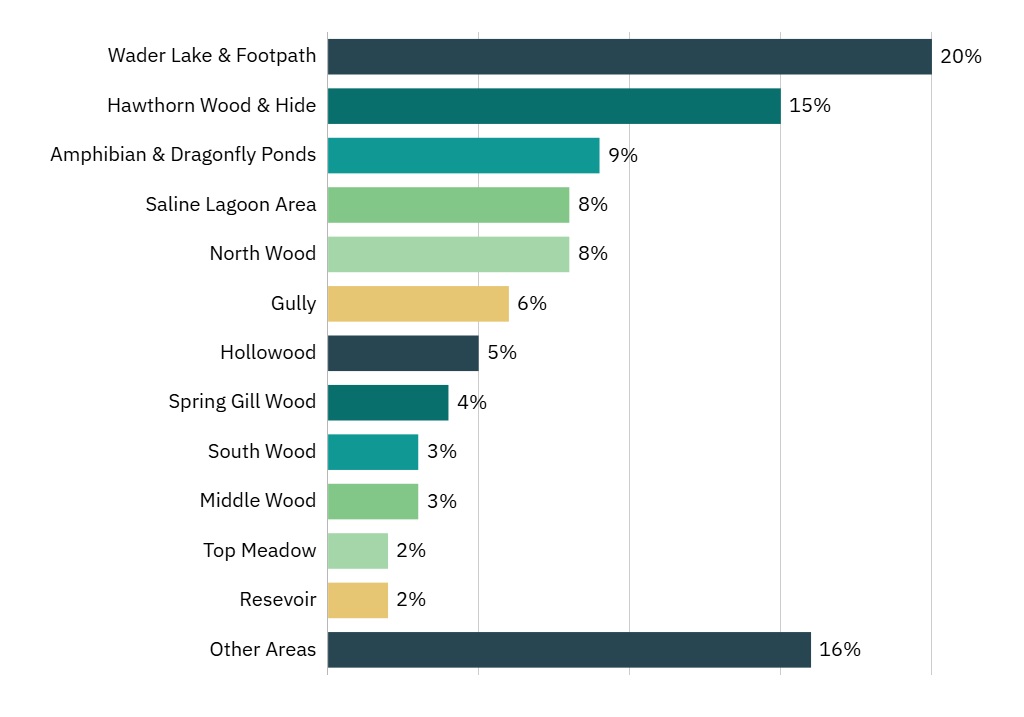
Most sightings take place around Wader Lake (particularly the footpath which runs alongside the lake) and while this could potentially be explained because of a favourable habitat for the blackcap here, available food and water around both the lake and the river and dense hedgerows for the birds to hide in, as well as being a natural corridor that smaller birds will take between Wader Lake and the river, it can also be attributed to something we have not talked about yet in a Data Dive - recorder bias.
Remembering that the collection of these records is a human undertaking is incredibly important and can often be difficult when simply looking at graphs and charts, but we mustn’t forget that every bird recorded has been spotted and counted each day by someone outside walking the site. External factors such as poor visibility from weather, sickness or needing to prioritise tasks can influence the collection of data.
With the footpath being a main route that the reserve team use while performing site checks (particularly the daily fox proof fence check, which runs alongside the whole footpath) and doing their counts, it’s understandable that this area could potentially receive more sightings than others - although we know that the blackcap will likely be just as present here as other areas on site.
Thankfully, with such a large pool of recorded data available spanning back decades - data taken from multiple sources such as the daily site counts, photography, member and volunteer wildlife logs- as well as having our incredibly knowledgeable team here at Washington, we can get a pretty clear understanding of what is and isn’t bias within our records.
It also means we can say that, even though the raw data makes the Wader Lake footpath appear to be the best spot to see blackcap in April - you’re probably just as likely to see them at the Hawthorn Wood Hide feeding station!